

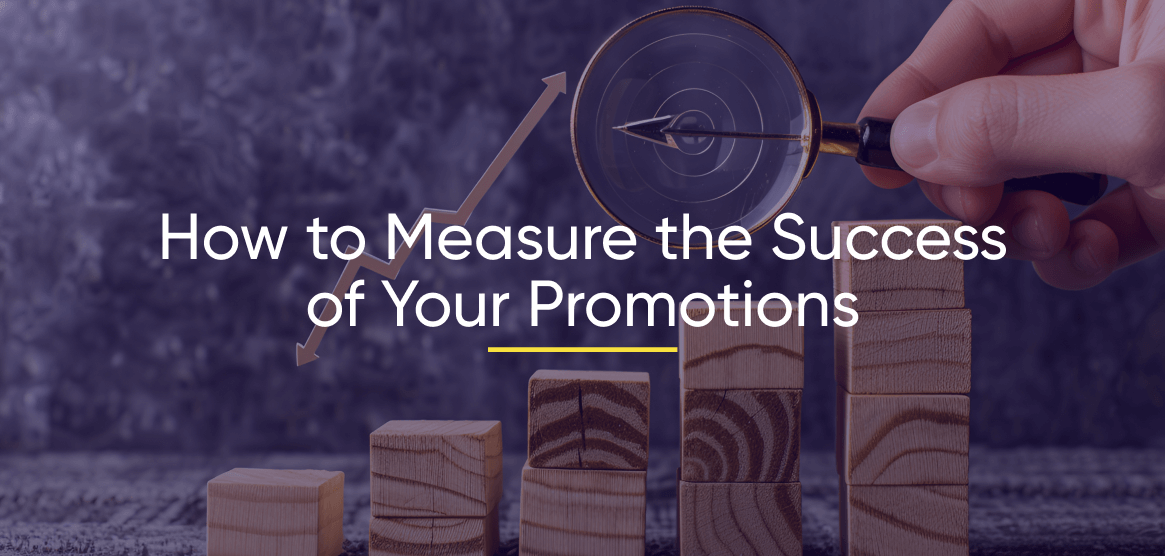

Measuring promotion performance is just as important as running the promotion itself. Marketers and CRM executives need to know which offers truly boost sales, attract new customers, or foster loyalty. In this guide, we’ll outline how to evaluate different types of promotions – primarily in digital channels (on your website) – and highlight the key metrics (KPIs) for success. We’ll also include a section on in-store promotions, since brick-and-mortar promotion campaigns require a slightly different measurement approach. By the end, you’ll have a clear, skimmable roadmap to gauge the ROI and impact of various promotional tactics.
Key Digital Promotion Types & Metrics
For online promotions, you have the advantage of rich data tracking via your website and analytics tools. Below we break down common digital promotion types, with a brief definition, the KPIs to monitor, and tools/methods for tracking success for each.
1. Promotional Pricing (Discount Sales)
A temporary price reduction on products or services (e.g. 20% off sale) to spur demand or reward customers. This could be site-wide sales, seasonal discounts, flash deals, etc.

Key KPIs:
- Conversion Rate: what percentage of site visitors or ad viewers actually purchased at the promo price)
- Sales Uplift: increase in units sold or revenue during the promo vs. baseline period
- Average Order Value (AOV): does a discount encourage larger baskets or just smaller spend
- Promotion ROI: profit gained vs. revenue lost from the discount
2. Bonus Products (Gift with Purchase)
Offering an additional product or gift for free when the customer purchases a specific item or exceeds a spending threshold. For example, “Buy one, get a free gift” or “Spend $100 and receive a free tote bag.”
Key KPIs:
- Uptake/Redemption Rate: how many customers qualified for and received the bonus item, out of those offered
- Incremental Sales: did the bonus incentive increase the number of purchases or basket size
- Average Order Value: customers might add extra items to their cart to meet the threshold for the free gift
- New Customer Acquisition: is the bonus is meant to attract new shoppers (e.g., a free welcome gift)
- Customer Retention Rate: observe whether a free gift improves satisfaction and repeat purchases
3. Free Samples or Trials
Providing a free sample of a product (or a limited-time free trial for services) to let customers experience it without commitment. This is common for new product launches or premium items (e.g., a free sample sachet added to online orders, or a 30-day free software trial).
Key KPIs:
- Sample-to-Purchase Conversion Rate: the percentage of people who tried the sample and then went on to buy the full product
- Reach: how many people received the sample) and subsequent
- Lift in Sales: for the sampled product
- Customer Feedback: satisfaction scores or reviews after sampling indicate if the promotion is creating positive buzz. Another important metric is
- Cost per Acquisition (CPA): essentially, how much did it cost in free samples to acquire one new paying customer

4. “Buy X, Get 1 Free” Deals (BOGO Promotions)
A classic BOGO (“Buy One, Get One”) promotion where a customer gets an additional product for free (or sometimes at a discount) after purchasing a certain quantity. Example: “Buy 2, get 1 free” on a specific category or mix-and-match items.
Key KPIs:
- Total Units Sold: BOGO deals often aim to increase the quantity of items each customer buys, so measure the lift in units per transaction
- Promotion Redemption Rate: what proportion of transactions eligible for the deal actually utilized it (e.g., how many customers bought the required X items to get the free one)
- Revenue and Margin : ensure that the increased sales volume is offsetting the cost of the free product
- Customer Acquisition or Retention: did this deal bring in new shoppers or encourage repeat purchases? BOGO can attract bargain hunters, so see if those customers come back. Also monitor
- Inventory Turnover: did the promotion help move a particular product efficiently
5. “Buy X for $Y” (Multi-Buy Discounts)
A promotion where shoppers pay a set price for buying a certain quantity of items. For example, “Buy 3 for $20” (instead of $8 each) – commonly used to increase volume by offering a bulk deal. This differs from BOGO because it sets a bundle price for multiple units.
Key KPIs:
- Units per Transaction: are customers buying larger quantities than usual to get the deal?)
- Average Spend per Customer often goes up with multi-buy promotions, so monitor AOV during the promo.
- Margin Impact – calculate the effective discount per unit to ensure the deal remains profitable
- Stock Clearance Rate if this was intended to move surplus stock (how much of the inventory was sold under the promotion?)
- Conversion Rate – does the presence of a bundle price convert browsers into buyers more effectively than without the deal?
6. Bundles (Product Bundling Promotions)
Combining multiple related products into a package sold at a special price. Bundles often pair complementary items (e.g., a camera + memory card bundle) or a “kit” of products that make sense together. The appeal is convenience and a better total price than buying each separately.
Key KPIs:
- Bundle Uptake Rate: what percentage of customers purchase the bundle when it’s offered (versus buying items individually or not at all)
- Average Order Value: successful bundles should raise AOV by encouraging the purchase of multiple items in one go
- Attachment Rate: if the bundle is optional (e.g., suggested on the product page), measure how often customers add the bundle to the cart
- Revenue & Profit: track total revenue from the bundled items vs. separate, and ensure the discounted bundle still meets profit goals
- Customer Satisfaction: whether the bundle is meant to simplify choice (survey or review feedback might indicate if customers found it valuable)

7. Product Sets (Pre-configured Sets or Collections)
Similar to bundles, a product set is a pre-packaged collection of items, often sold together for convenience or theme – for example, a gift set (multiple products in a box) or a set of items in the same category (like a set of 6 dining chairs). The distinction is that product sets might be presented as a single product comprised of multiple pieces.
Key KPIs:
- Sales Volume of the Set: how many sets sold
- Comparison to Individual Sales: did the introduction of a set increase total category sales or just shift sales from single items to sets
- Average Revenue per Order: how much money is generated on a per-order basis
- Sell-through Rate: especially important if the sets are targeted for a specific reason or season
- Customer Feedback: product sets can enhance perceived value or convenience, so look for reviews or ratings on the set vs. individual items
8. Price Reduction & Clearance Sales
A straightforward promotion where prices are slashed on selected items, often to clear inventory or react to competitive pricing. This includes clearance sales (end-of-season markdowns) and permanent markdown strategies. Unlike a limited “promotional pricing” event, price reductions may be longer-term or focused on specific products that need a sales boost.
Why it works:
- Sell-Through Rate: especially for clearance, track what percentage of the stock was sold during the promotion period
- Time to Clear Stock: how quickly did items sell out after the price cut (a fast sell-out indicates success, though stockouts can also mean underestimating demand)
- Revenue vs. Markdown Cost: calculate how much revenue was gained and how much potential revenue was lost due to the lower prices (this ties into promotion ROI again)
- Customer Traffic: significant price drops can drive additional traffic (online visits or sessions) so monitor site traffic and engagement when the sale is announced
- Conversion Rate: for these discounted items – are more browsing visitors converting into buyers given the new price
- Customer acquisition: track new customers who make a purchase because of the sale. And if the sale is meant to improve cash flow or inventory turnover, metrics like
- Days of Inventory Remaining: in case sale is meant to improve cash flow or inventory turnover
9. Promo Codes and Digital Coupons
Using alphanumeric codes or digital coupons that customers input at checkout to obtain a discount or special offer. Promo codes are popular in digital marketing and promotion campaigns because they’re easily trackable and can be targeted (unique codes per campaign or influencer). For example, “SAVE20” for 20% off, or one-time codes given to specific customers.
Key KPIs:
- Redemption Rate: how many of the issued or distributed codes were actually redeemed by customers (e.g., if 10,000 codes emailed and 500 used, that’s 5% redemption). Note that average digital coupon redemption rates can vary
- Conversion Rate for Coupon Users: do those who enter the promo code complete the purchase at a higher rate?
- Incremental Sales: measure sales that can be attributed directly to the promo code promotion campaign (often using unique codes or tracking URLs)
- Average Discount per Order: how much value customers are getting; coupled with volume, this affects revenue
- Customer Acquisition vs. Retention: was the code aimed at new customers? Then track how many new customers used it and if they returned later. If aimed at existing customers (loyalty or win-back offers), track repeat purchase rates
- Channel Attribution: promo codes often tell you where the sale came from (e.g., a code used mainly on Instagram tells you that channel drove those conversions)
10. Cross-Selling Promotions
A tactic where you promote complementary or related products to customers alongside their current selection. This often appears as “You might also like…” or “Frequently bought together” suggestions on an e-commerce site. Cross-selling isn’t a discount per se (though it can be paired with one), but it’s a promotion strategy to increase basket size by suggesting additional items.
Key KPIs:
- Cross-sell Conversion Rate: how often do customers add a recommended product to their purchase? (For example, if 100 customers see a recommendation and 5 add it, that’s a 5% conversion on cross-sell)
- Average Order Value (AOV): a successful cross-selling approach should raise the AOV because customers buy more items
- Percentage of Orders with Cross-Sell: what fraction of orders include at least one item from a recommendation engine
- Upsell/Uplift Revenue: the extra revenue attributed to cross-sell items (tracked via analytics tags or promotion engine attribution)
- Customer Satisfaction: relevant recommendations can enhance experience, but pushing unrelated items might annoy customers (feedback or NPS can catch this)

Measuring In-Store Promotion Campaign Success
Digital metrics are powerful, but what about in-store promotions at physical retail locations? In-store promotion campaigns (like in-store coupons, demos, BOGO deals in a shop, endcap displays, or free sample stations) require a different approach to measurement. The goals are similar – drive sales, move inventory, gain loyalty – but data collection is more manual or indirect. Here’s how to gauge the success of your brick-and-mortar promotions:
- Foot Traffic & Conversion: Track how many people enter your store during a promotion and how many make a purchase. Tools like people counters or smart cameras help measure entries. Comparing that to sales gives your conversion rate. For example, 1,000 visitors and 300 purchases equal a 30% conversion. A spike in foot traffic with low conversion may signal interest without follow-through—possibly due to unclear messaging or poor offer relevance.
- Sales Lift & ATV: Compare sales during the promo with a similar timeframe to gauge revenue impact. Monitor Average Transaction Value (ATV) to see if shoppers are spending more—e.g., a jump from $30 to $50 suggests effective upselling. Bundle deals or “buy more save more” offers can drive this increase.
- Redemption & Response Rates: If your promo requires an action (like showing a coupon or signing up for a loyalty card), calculate how many participants followed through. A 5% redemption rate from 1,000 distributed coupons = 50 redemptions. Response rate measures how many store visitors engaged with the promo, such as 100 of 500 visitors using a deal (20%).
- Loyalty & Retention: Use loyalty data or POS records to see if promo participants return or spend more later. Track repeat purchases, new customer sign-ups, or increased visit frequency after loyalty-point promos or member events.
- Customer Feedback: Gather feedback via in-store surveys or post-purchase emails. Ask if the promo was clear, useful, or enjoyable. Even anecdotal insights—like reactions to a free sample station—can reveal the promo’s long-term value.

Conclusion
Promotions can be powerful drivers of growth – but only if you measure their success with the right metrics. By setting clear goals for each promotion type and tracking KPIs like conversion rates, redemption rates, average order value, and ROI, you turn marketing into a data-driven endeavor.
As for Promotion Engines — the technology that allows you to run promotions — Antavo’s Promotions was designed to help brands engage both loyalty members and non-members, this new engine empowers marketers and developers alike to build compelling promotions that drive conversion and retention. It stands out for its real-time processing, boasting a performance of over 100,000 requests per minute and an average response time of 60 milliseconds.
If you are interested in our Promotion Engine, make sure to get in touch with our experts for a product demo — or watch our introductory video:

Tamas Oszi Tamas Oszi LinkedIn profile
Tamas is the Head of Content at Antavo and a Certified Loyalty Marketing Professional - CLMP. Tamas is known for having a keen eye for loyalty and customer retention strategies and trends. Tamas is also a true gamer at heart and has an impressive collection of cyberpunk books.


